Just published Part 3 here, but below is Part 2 (and 2a) for Cougarboard to digest (when you have an extra 40 minutes...)
Why the PAC10 is Struggling to Make a Media Deal:
Part 2–How Strong Are PAC12 “Brands” & Fan Bases?
Link to Part 1: Intro
Conference realignment is a brutal business. The PAC10 leftovers can commiserate with the Big12 “leftovers” on the pain of losing their top brand. USC was the top Football brand in the PAC12 as was Texas in the Big12. Zack Miller’s ranking of Football Program Value (discussed below) confirms this with Texas (8th), Oklahoma (10th), USC (19th), and Oregon (24th) topping their respective conferences. Fortunately (or unfortunately?) for the PAC10, the B1G desired the whole of the LA market more than they coveted getting the PAC12’s second best brand, Oregon.
There are various ways to try to measure a school’s brand value and fan base, none ideal. Attendance figures, TV viewership, and social media engagement all give a partial glimpse of a school’s brand value, but will all be discussed in their own forthcoming installments in this series. However, as a preview, our analysis of these and enrollment/alumni metrics continue to drive home a few key points:
-
The PAC10 holds many advantages over the Big12 in relevant metrics such as TV viewership, TV market size, total alumni, enrollment, and overall football brands.
-
Despite these advantages, the PAC10 seems to be a bit of a “Paper Tiger,” as they lag behind the Big12 in many brand/fan base metrics such as attendance, social media engagement, and overall sports popularity on “Google Trends.”
-
The Big12 is either closing the gap, or, in some cases, has surpassed the PAC12, in nearly all these metrics.
The last point is vital– the trajectory and potential of a conference are pivotal. Recall Jon Wilner, speaking of SMU’s possible addition to the PAC10, stated:
“We view adding SMU as a member in similar fashion to adding Amazon as a media partner: Neither entity can be judged on its merits as of today; both must be evaluated for what they could be in the future”
So, where does each school currently rate on alumni and enrollment figures?
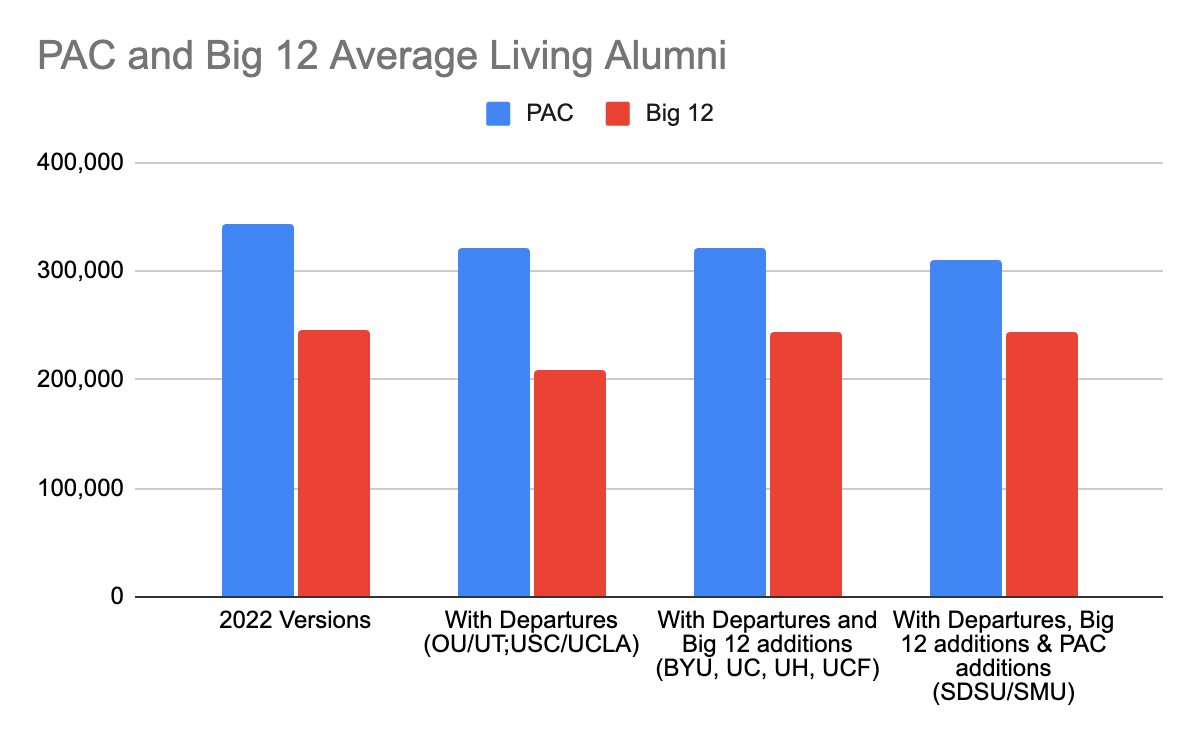
Figure 1: (Link to Spreadsheet)

Total living alumni and student enrollment clearly represent the “low hanging fruit” of likely fans. In these metrics, the PAC10 has a marked advantage over the Big12 with an average of nearly 75K more claimed “total living alumni” per school and nearly 120K more alumni per Linkedin stats.
[Interestingly, the elite academic institutions, Stanford, UCLA and Cal, have significantly more Linkedin Alumni than their claimed “total living alumni” figure. Not exactly sure what to make of this, but it could be anything from employees or current students claiming to be alumni (or maybe there are plenty of “resume fibbers” on Linkedin?)]
Figure 2:
Current enrollment figures similarly show a solid advantage for the PAC10 over the Big12, about 3K more undergrads and ~6K more total enrollees per school. In fact, Arizona State leads the entire nation with 63K undergrads & 75K in total enrollment. It appears that the Big12 placed a premium on large student bodies (especially undergrads, who are more likely to become lifelong fans than grad students) when adding new schools. UCF, Houston, BYU and Cincy are all within the top 5 in their new conference (UCF trails only ASU nationally with ~61K undergrads & ~72K total enrollees.) The Big12’s average total enrollment of the remaining 8 schools was only ~25K, compared to the PAC10’s @ ~39K per school–a huge gap. Adding UCF, UH, BYU, & Cincy brought the Big12’s average markedly, from ~25K to ~33K.
Figure 3:

Potential PAC12 expansion candidates show mixed results here with SDSU having 31K undergrads, above the PAC10’s average, but SMU would be far below, with just ~7K undergrads and ~12K total enrollees. Those figures are in the realm of Stanford and TCU, which have the smallest enrollment of their respective conferences. Obviously not a deal breaker, but probably a strike against the Mustangs.
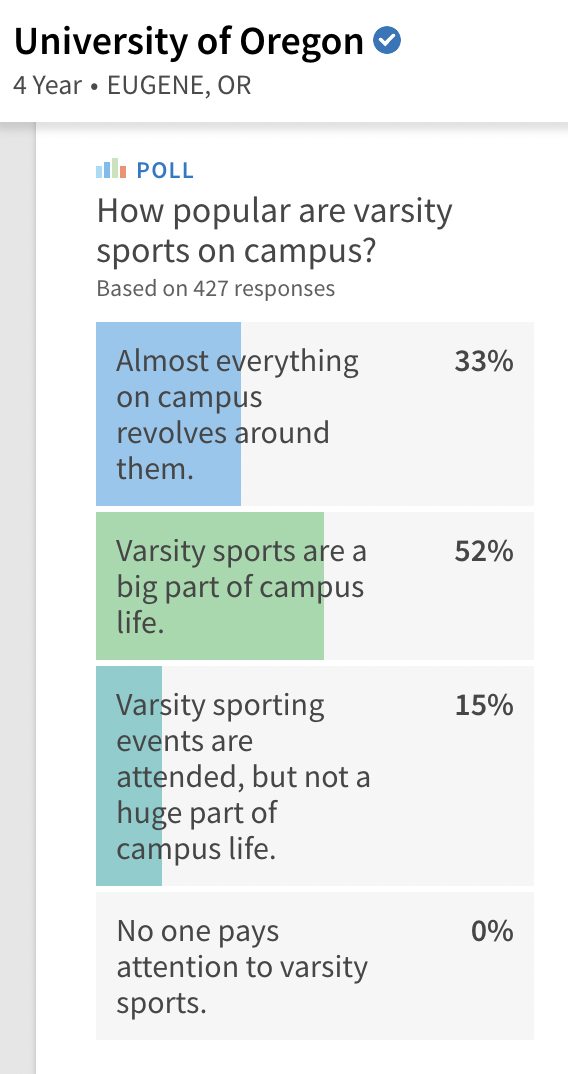
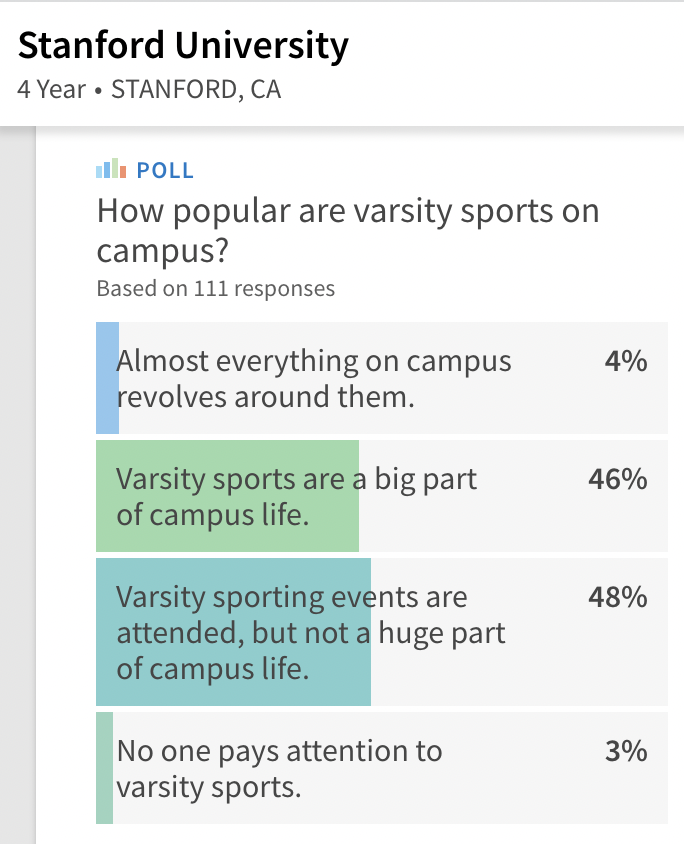
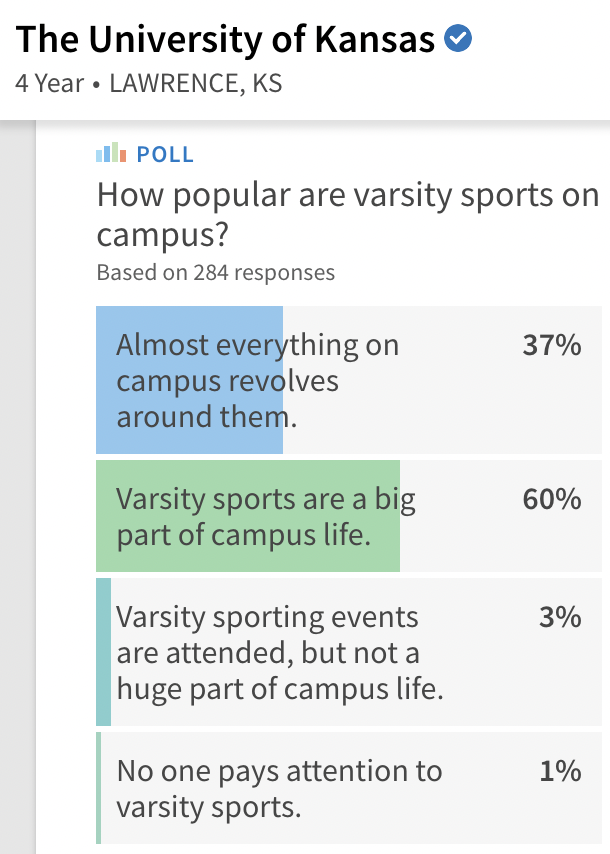
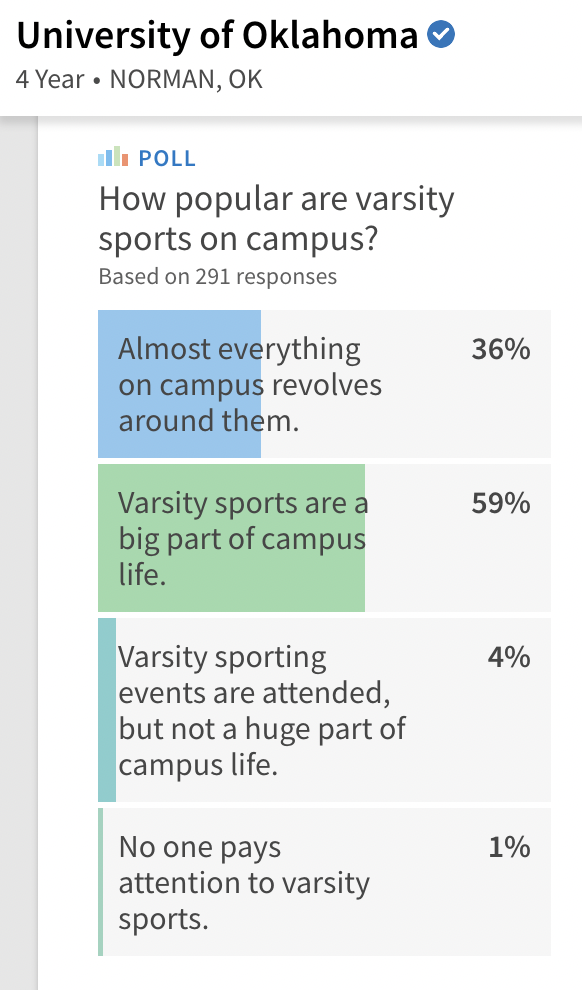
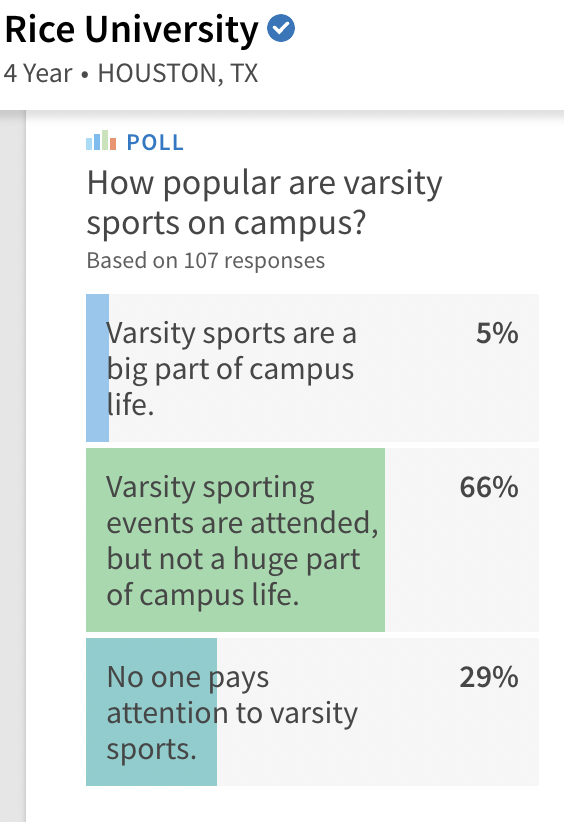
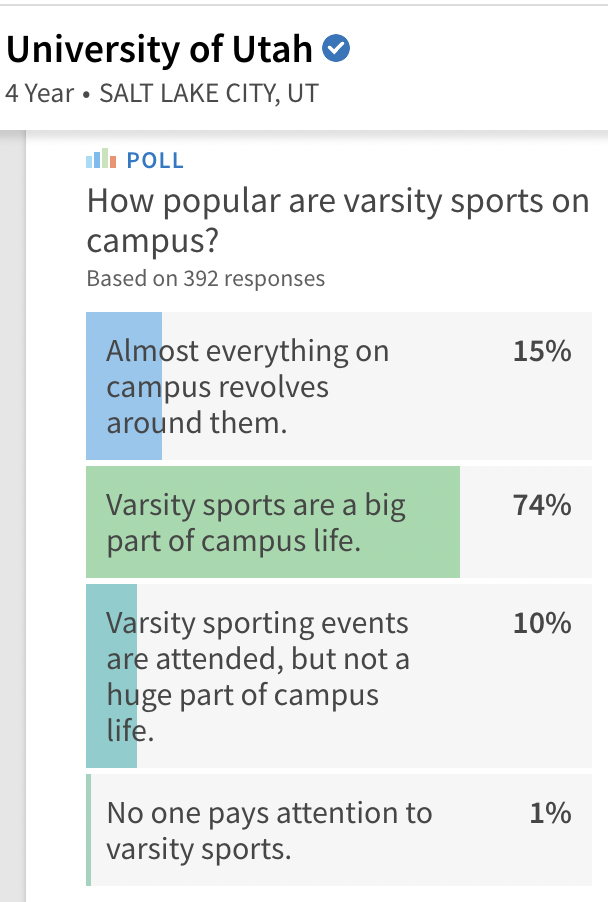
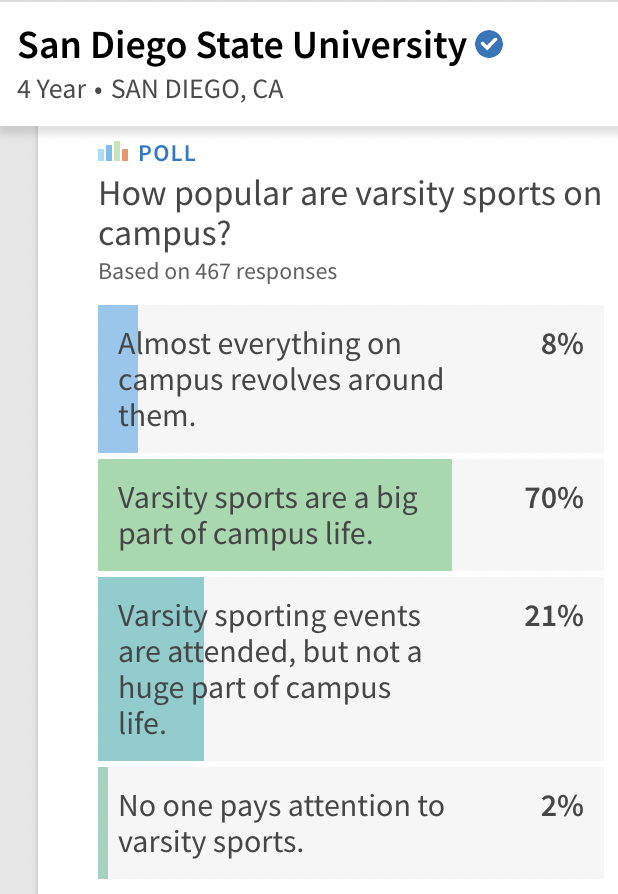
While having a large student body provides potential for developing a large fan base, how actually engaged are those students in sports? Recent Niche polling at each campus contained the question: “How popular are varsity sports on campus?”
The results?
Double the number of PAC10 students responded either that sports “were attended, but not a huge part of campus life” or “nobody pays attention” compared to Big12 students (combined 24% vs 12%; compiled data at spreadsheet) This level of investment, or fan engagement, appears to be a strong and consistent advantage the Big12 holds over the PAC10, and seems to be rather congenital, starting even from a student’s days on campus. (See footnote for further discussion/analysis on these findings)
Figures 4a,b,c
Speaking of SDSU & SMU, Zack Miller’s Football Program Value rankings, referenced above, were not kind to them, coming in at 80th and 81st respectively among the 90 schools he evaluated (see Table 3 below). This compares to the PAC10’s average of 44th and the Big12’s average of 47th. Adding the Aztecs and Mustangs to the PAC10 would flip them from three spots ahead of the Big12, to 3 spots behind, dropping to 50th. The inclusion of a wide variety of metrics (Attendance, TV Viewership, Valuation, Market size/share, & Social Media following) help make Miller’s system among the broadest attempts at ranking programs. I applaud Miller for his work compiling these rankings, while realizing some of the shortfalls.
Miller’s results are somewhat skewed by including the WSJ’s relatively dated “College Football Value Rankings” from 2018 (Table here.) This ranking system relatively punishes anyone not receiving a P5 conference payout and produces some quirky results even within the P5 teams (is Northwestern football really 3X more valuable than West Virginia? Is Oregon State worth more than BYU? Is Cal 5X more valuable than Houston? Is Arizona State worth more than Clemson and are they each 10X more valuable than Cincinnati?) In fact, only BYU (60th), Boise St.(63rd), and UCF (65th) surpassed ANY P5 programs at all, those being the usual laggards of Vandy, Boston College, Wake Forest, Duke, & Rutgers plus the odd placement of WVU as the LEAST valuable of any P5 football program (FYI SMU and SDSU were 74th and 80th respectively in these WSJ valuations.)
[Miller also included Nate Silver’s 2011 attempt at quantifying each school’s football fanbase in his valuation system. We discuss Silver’s and Tony Altimore’s similar attempt in this companion piece.]
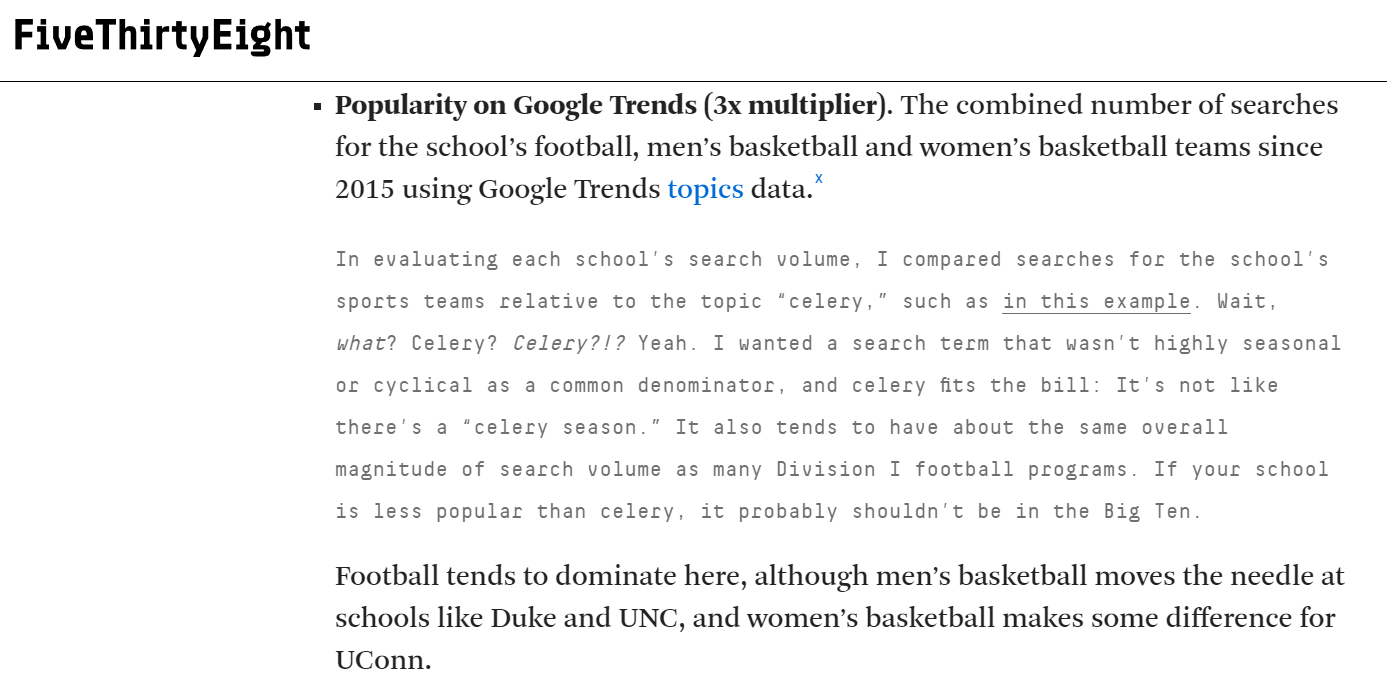
“Popularity on Google Trends” is another interesting metric, and one that New York Time’s Nate Silver recently used when exploring who the B1G should add next (see clip below of a footnote from said article about this system):
Figure 5
We replicated Silver’s exact parameters for the PAC10, Big12, and potential expansion candidates and found that Oregon was solidly above any remaining team at 88.9% relative sports value compared to Texas. They even beat out departing USC/UCLA by a large margin (their CFPlayoff appearance in 2015 was a large factor bringing their value up; but even removing 2015 for the Ducks, they still led the way at 70.9% and the PAC10’s average team value only dropped from 30.8% to 29.0%.) It’s not unreasonable to conclude that Oregon is the biggest sports brand the PAC12 has had over the past decade, but that the B1G placed such a premium on large TV markets and academics, that they decided to pass on the Ducks on their first westward expansionary foray.
Kansas led the way for the Big12 in this combined sports metric of “Popularity in Google Trends,” showing the enormous strength of their “Blue Blood” Basketball program. Interestingly, two new Big12 additions, UCF and BYU, surpassed 8 of the 10 remaining PAC10 schools over this 7 year period, trailing only Oregon and Washington. Only two of the Big12’s teams, TCU, and Houston fell below the 24% threshold, whereas half of the PAC10 schools did. Eight PAC10 brands (80%--all but Oregon and UW) fell below the 30% threshold,
Figure 6: (Spreadsheet link)
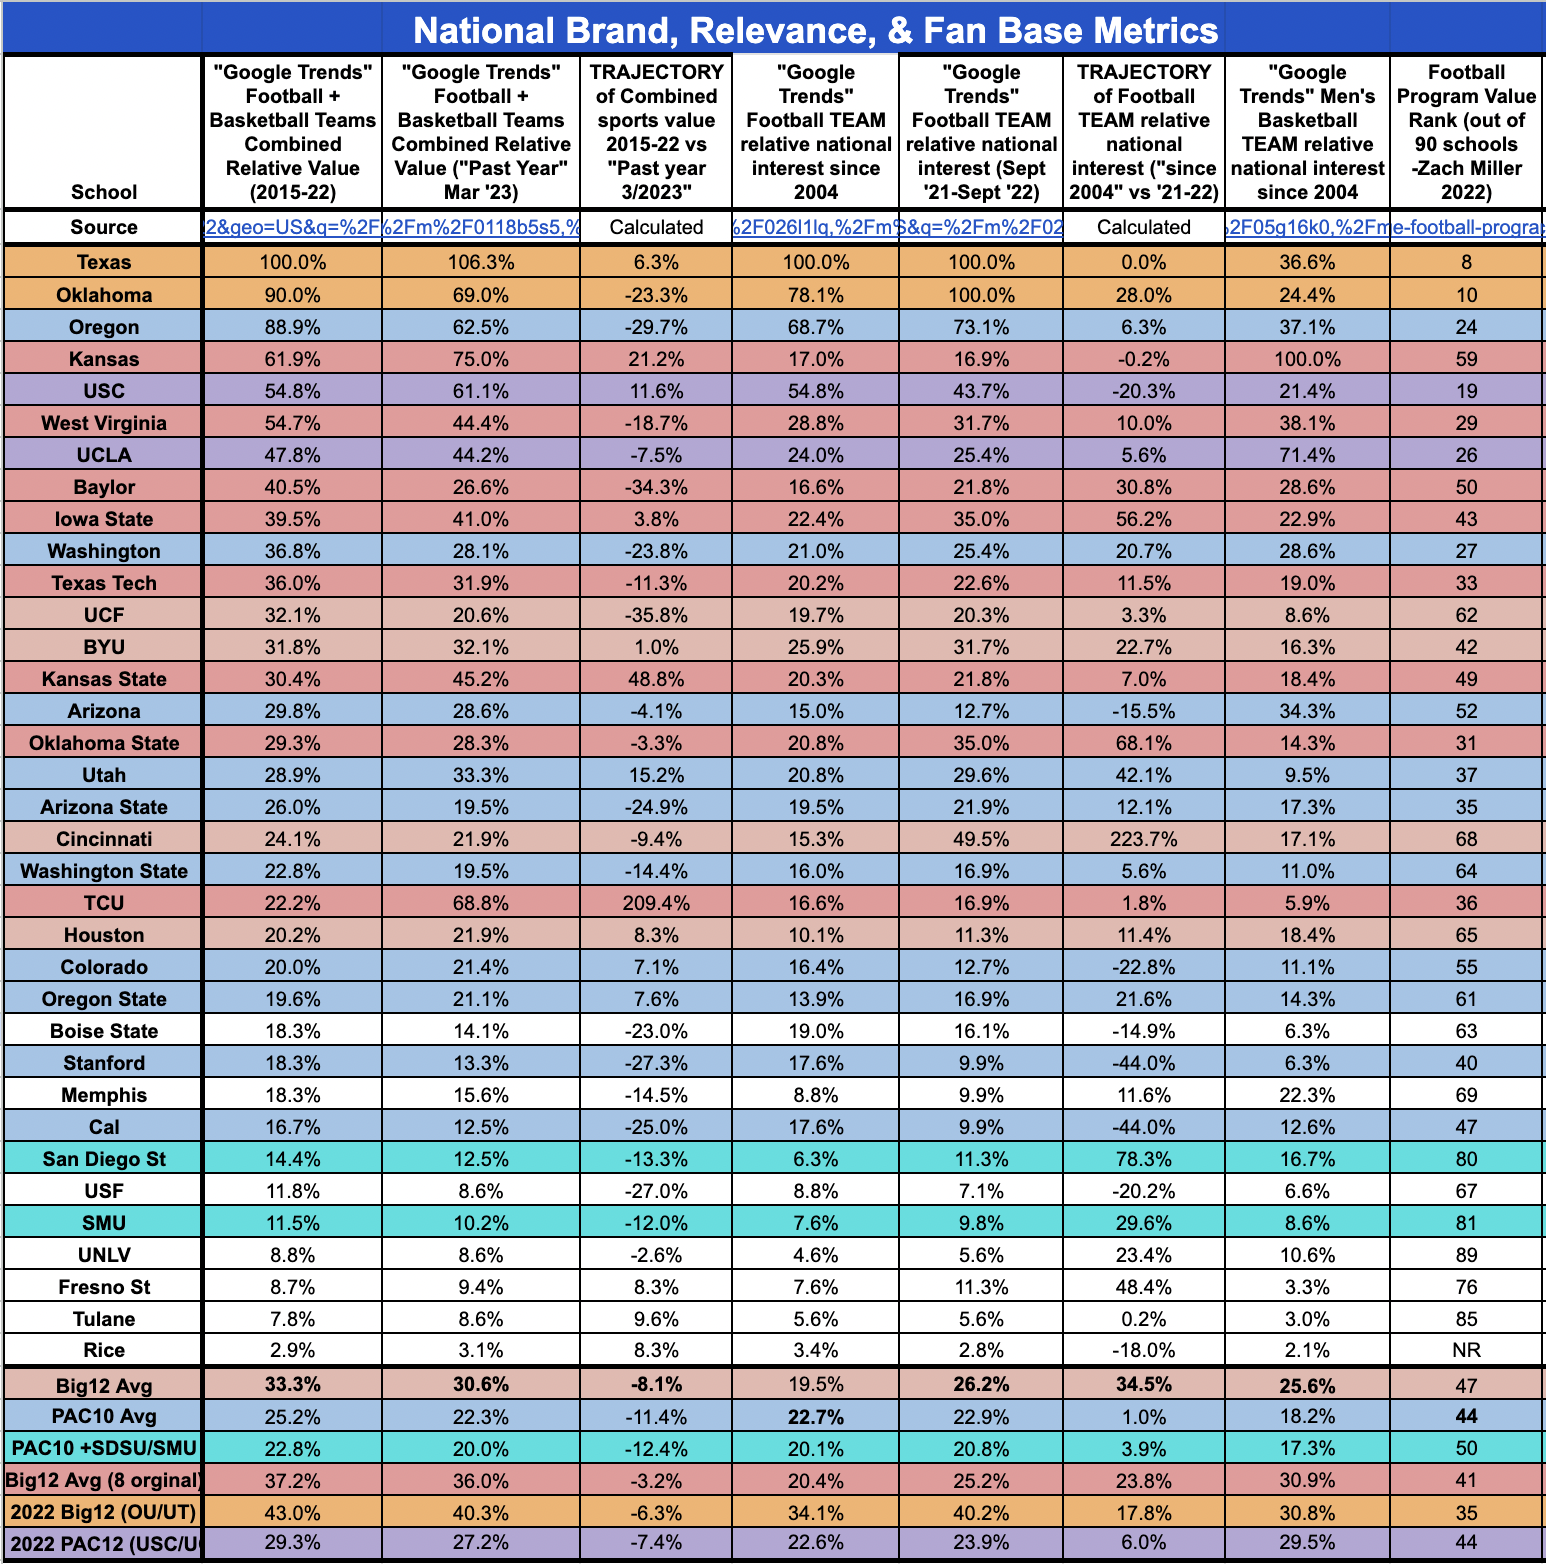
These findings, again, call into question SDSU and SMU’s relative media contract value as they came in at 14.4% and 11.5% respectively, well below the PAC10’s average of 25.2%. In fact, their COMBINED value (25.9%) barely reached the PAC10’s average. Compare that to the two lowest of the Big12 newcomers: Houston at 20.2% and Cincinnati at 24.1%-- a combined value of 44.3%, well above the Big12’s average of 33.3%. This 33.3% figure, well above the PAC10’s 25.2% for the 2015-22 time period, shows the Big12 has had a stronger sports brand in recent years. Given the long-term and well-recognized historical brand superiority of the PAC12, these findings seem to show a relative decline of the PAC10 (vs surge for the Big12) in brand popularity.
Just searching the last year’s data for all three sports, The Big12 still maintained a sizable average popularity gap of 30.6% compared to the PAC10’s 22.3%, representing a slightly widening gap between the two conferences, even when just selecting for the last 12 months.
Put a different way, according to “Popularity on Google Trends” data:
Lastly, looking at “Google Trends” search data for each individual Football Team in 2021-22 compared to a long-term window (2004-present) showed a relative uptick of only 1% per team in the PAC10 compared to an increase of 34.5% for the new Big12. Additionally, The PAC showed a higher value over the last two decades (22.7% vs 19.5% for the Big12) whereas the Big12 takes the lead in the more recent window analyzed (26.2% vs 22.9%).
This data fits with our thesis that, despite some baked in strengths and advantages, the PAC10 has been on a concerning negative trajectory for quite some time, that this is why the PAC10 is struggling to secure a lucrative media deal.
Stay Tuned for the next installment: Part 3–TV Viewership.
**Disclaimers:
-
The data aggregation has been a long-term effort over several months and some of the metrics (Especially “Google Trends”) were compiled during or, at times, preceding the 2022 football season. Due to the rather time-sensitive nature of PAC12 Conference expansion, we proceeded with what was already compiled.
-
Similarly, the enrollment figures have recently changed since they were extracted from USNWR’s site. The USNWR links generally show a small decreased enrollment at most schools. However, a sampling of Forbes current enrollment data shows nearly all schools with increased enrollment compared to what USNWR reported for either year (examples for UCF, ASU, Washington, Texas Tech, BYU, Cal, UCLA, Rice, TCU, Utah, SDSU, & SMU)
-
Figures related to Footnote 1 below:


Why the PAC10 is Struggling to Make a Media Deal:
Part 2a–Comparing Silver & Altimore’s Fan base rankings
Zack Miller’s ranking system also included Nate Silver’s 2011 attempt at quantifying each school’s total football fan base. Often debated, Silver did attempt to provide a “total fans” estimate for each FBS school and employed some interesting methodology. While largely in line with “passing the smell test” with the results, there were a few “stinkers.” Oregon was only allotted 628K fans (45th) compared to Cal’s 950K fans (31st). Illinois at 27th with only 100K fewer fans than Georgia’s 1.1M (22nd) didn’t seem quite right. And Georgia Tech at 11th nationally with 1.7M fans was quite head-scratching…
We considered including both Silver’s 2011 fan base findings and comparing them to Tony Altimore’s more recent attempt, but the findings for both were puzzling enough as to call into question the underlying methodologies (GIGO principle: “Garbage In = Garbage Out.”) While both are to be commended for delving into this complex question, we felt it best to not include either as truly accurate measures. Similar to the oddities listed with Silver’s attempt, Altimore’s findings, which he calls a “synthesis of 2011, 2014 & 2019 NYT + 538 studies,” (though we could not find an explanation of how these were weighted) vaulted Oregon up to 7th in the nation, with 5.54M estimated fans, ahead of Alabama, LSU, and Georgia. His findings claimed that Syracuse had the 14th largest FOOTBALL fan base with 3.45M fans, ahead of Tennessee, Oklahoma, Florida State, Nebraska, and Clemson. Claiming that Ohio State (#1 with 11.26M fans) had nearly double the fans as Michigan didn’t win him any friends or respect in Ann Arbor either. USC at #10 seemed overvalued as well when they rank 22nd in average attendance and 25th in TV Viewership over the last few years.
We ran a quick analysis comparing these two systems and found the following results:
Table 2 ( Link here with individual school estimates from both systems)

|
Conference
|
Total football fans per school (NYT 2011 Nate Silver)
|
Total football fans per school (Tony Altimore 2021)
|
% change in fan base size Silver vs Altimore
|
|
SEC
|
1,257,563
|
3,379,375
|
168.72%
|
|
B1G
|
1,326,188
|
3,210,625
|
142.09%
|
|
ACC
|
898,286
|
1,676,429
|
86.63%
|
|
Big12
|
545,167
|
964,167
|
76.86%
|
|
PAC10
|
516,100
|
1,650,000
|
219.71%
|
While the eye-catching finding is Altimore showing a large increase in PAC10 fan bases (especially relative to the other conferences,) the majority of this can be explained by the disparate findings for the Oregon Ducks alone, nearly a nine-fold increase. While it’s pretty clear that Silver’s system vastly underestimated Oregon’s fan base, it’s also pretty apparent that Altimore’s system overestimated it. As with most things, the truth is surely somewhere in the middle. Again, it’s complex and confusing and we don’t feel comfortable putting too much stock into either of these systems.